Introduction
Picture this: A laundry plant manager sits down with the monthly P&L statement. Revenue is up 8%, but profit margins are flat—or worse, shrinking. Utilities costs seem high, but is that normal? Labor hours have increased, but is productivity keeping pace? Without clear benchmarks and the right KPIs, these questions remain unanswered, and the manager is essentially flying blind.
Industrial laundry operations run on razor-thin margins where small inefficiencies compound into major profit drains. Without the right Key Performance Indicators, operators can't pinpoint whether low profitability stems from labor inefficiency, equipment downtime, rewash costs, or utility waste.
This guide identifies the KPIs that actually drive profitability, explains how to measure them accurately, and provides industry benchmarks so managers can make decisions based on data—not guesswork.
Key Takeaways
- Laundry KPIs fall into 5 categories: Productivity, Quality, Cost Efficiency, Safety, and Customer Satisfaction
- Core metrics: PPOH (Pounds Per Operator Hour), rewash rate, labor cost per pound, utilities cost per pound, and on-time delivery
- Industry benchmarks: 30–150+ PPOH, under 3% rewash rate, and $0.19–$0.26/lb labor cost
- Review operational KPIs weekly, financial KPIs monthly — real-time dashboards catch cost trends before they become problems
Why KPIs Matter in Laundry Operations
Industrial laundries are capital-intensive, labor-heavy operations where labor costs consume 35-55% of total operating expenses. When inefficiencies creep into your operation, the margin erosion compounds fast.
"Gut feel" management fails at scale. Without KPIs, you can't tell whether declining profitability traces back to labor inefficiency, equipment downtime, rewash costs, or utility waste—so every corrective action is a guess.
Leading vs. Lagging Indicators
Understanding the difference between these two indicator types is critical:
- Lagging indicators (cost per pound, net margin) tell you what already happened; by the time they surface, the damage is done
- Leading indicators (PPOH, PM completion rate) let you fix problems before they damage profitability
A healthcare laundry using real-time production tracking discovered their dryer over-dry cycles were costing $15,000 annually in excess gas usage—a problem they could only identify by tracking equipment performance metrics, not just reviewing monthly utility bills. That kind of visibility is what separates reactive operations from ones that improve continuously. In an industry where total production costs typically range from $0.46–$0.64 per pound, there's no margin to absorb problems you can't see.
The 5 Core KPI Categories Every Laundry Plant Should Track
Productivity KPIs
PPOH (Pounds Per Operator Hour) is the single most important productivity metric. It directly correlates to labor cost per pound — your largest variable expense.
Formula: Total clean pounds processed ÷ total labor hours
This metric reveals labor efficiency at a glance. If your PPOH drops from 120 to 100, you're now paying 20% more in labor cost for the same output.
Throughput rate (pounds processed per hour of plant operation) measures capacity utilization and helps pinpoint where production slows. Two patterns to watch:
- High throughput + low PPOH → labor inefficiency
- Low throughput + high PPOH → equipment constraints
Quality KPIs
Rewash rate measures the percentage of loads requiring reprocessing due to stains, insufficient cleaning, or quality failures. Industry best practices target rewash rates below 3%.
The hidden costs of rewash are substantial:
- Wasted water, energy, and chemicals
- Additional labor hours
- Delayed customer deliveries
- Accelerated textile wear
Reject rate tracks items damaged or lost during processing — a direct hit to both customer trust and textile replacement costs. Target: below 1% for most operations.
Cost Efficiency KPIs
Labor cost per pound (total labor cost ÷ total pounds processed) is a key profitability driver. Industry benchmarks range from $0.19-$0.26 per pound for facilities processing over 2 million pounds annually.
Utilities cost per pound reveals equipment efficiency and process optimization opportunities. Efficient operations target $0.07-$0.08 per pound for combined water, gas, and electricity.
Track costs by category:
- Processing labor
- Chemicals ($0.02-$0.03/lb)
- Maintenance
- Depreciation
Safety KPIs
TRIR (Total Recordable Incident Rate) is OSHA's standard metric for workplace injuries per 100 full-time employees. For 2024, industrial launderers averaged a TRIR of 2.9, while linen supply operations averaged 4.2.
Fewer injuries translate directly to lower insurance premiums, less unplanned downtime, and stronger employee retention. TRSA members achieved a 40.7% reduction in TRIR from 2019 to 2023, demonstrating the business value of rigorous safety tracking.
Customer Satisfaction & Service KPIs
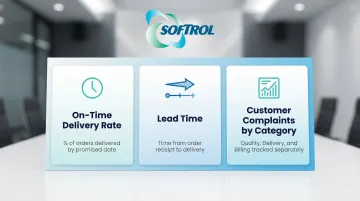
Three metrics define how customers experience your operation:
- On-time delivery rate — percentage of orders delivered by the promised date; the most direct measure of service reliability
- Lead time — time from order receipt to delivery; shorter lead times signal both operational efficiency and competitive flexibility
- Customer complaints by category — tracking quality, delivery, and billing complaints separately surfaces systemic issues before they affect retention
How to Measure and Calculate Critical Laundry KPIs
Measuring PPOH Accurately
Formula: Total clean pounds processed ÷ total labor hours
Include all production labor: sorting, washing, drying, finishing, folding, and packing.
Common mistakes:
- Excluding supervisors or QC staff (include them if they touch product)
- Miscounting pounds (using dirty weight vs. clean weight)
- Inconsistent measurement periods
Best practice: Track PPOH by shift, department (wash vs. finishing), and product type (linens vs. uniforms) to identify specific improvement opportunities.
Tracking Rewash and Reject Rates
Formula: (Weight of rewashed/rejected items ÷ total weight processed) × 100%
Implement a tracking system using tags, RFID, or manual logs to capture reasons for rewash:
- Stain type (oil, blood, food)
- Equipment failure
- Operator error
- Chemical dosing issues
When rewash rates spike, dig into the specific cause — chemical dosing, water temperature, load factor, or operator training — before making any process changes.
Calculating Labor Cost Per Pound
Formula: Total labor cost (wages + benefits) ÷ total pounds processed
Allocate indirect labor (maintenance, management, QC) across total production volume for accurate full-cost accounting.
Track trends over time rather than chasing a single target number. Directional improvement matters more than any one-period result.
Monitoring Utilities Cost Per Pound
Formula: (Total water cost + gas cost + electricity cost) ÷ total pounds processed
Install sub-meters on major equipment (washers, dryers, boilers) to identify inefficiencies at the equipment level. Modern equipment with moisture sensors and automated controls can reduce utilities cost by 10-20% compared to older machines.
Water efficiency target: 1.3-1.8 gallons per pound for efficient continuous batch systems with water reuse.
Implementing Safety and Maintenance KPIs
PM completion rate: (# of scheduled PM tasks completed on time ÷ total scheduled PM tasks) × 100%
Target: ≥95% completion. World-class operations achieve 80-90% planned maintenance, meaning most maintenance is scheduled rather than reactive.
Unplanned downtime rate: (Hours of unplanned equipment downtime ÷ total scheduled production hours) × 100%
Target: <5%
Beyond recordable incidents, tracking near-misses and safety observations builds a proactive safety culture — one that catches problems before they become stoppages.
Benchmark Targets: What "Good" Looks Like
PPOH Benchmarks by Automation Level
| Facility Type | PPOH Range |
|---|---|
| Manual/Low Automation | 30-40 lbs/hour |
| Moderate Automation | 70-90 lbs/hour |
| Highly Automated | 150+ lbs/hour |
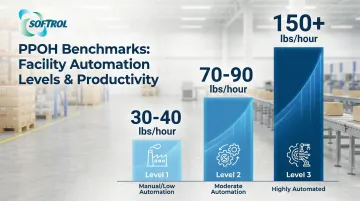
Automation is the primary driver of PPOH variance—automated facilities can be 2-3 times as productive as manual operations.
Once you know where your throughput stands, cost structure is the next variable to pressure-test.
Cost Per Pound Benchmarks (2021-2024)
| Cost Category | Benchmark Range |
|---|---|
| Direct Labor | $0.19-$0.26/lb |
| Utilities | $0.07-$0.08/lb |
| Chemicals | $0.02-$0.03/lb |
| Textile Replacement | $0.16-$0.19/lb |
| Total Production Cost | $0.46-$0.64/lb |
Benchmarks vary by region, equipment age, and product mix. Treat them as reference points, not hard rules. What matters most is directional progress—a 10-15% improvement per quarter is aggressive but achievable for operations actively tracking and acting on their data.
Building Your KPI Tracking System
Start with 8-12 weeks of baseline data collection across 5-7 core KPIs:
- PPOH
- Rewash rate
- Labor cost per pound
- Utilities cost per pound
- On-time delivery rate
Automation Options
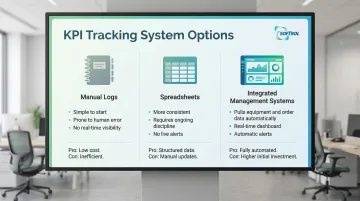
Three approaches exist, each with different trade-offs:
- Manual logs are the simplest starting point but introduce human error and eat up supervisor time.
- Spreadsheets improve consistency over paper but require ongoing discipline and offer no real-time visibility.
- Integrated management systems like Softrol's LOIS pull data from equipment, timekeeping, and customer orders into a single real-time dashboard — accessible from any device, with automatic alerts when a KPI drifts outside acceptable ranges.
Visualization and Engagement
Weekly KPI scorecards by shift or department keep performance visible where it matters. Post results on the production floor, not just in management meetings — frontline workers act on what they can see.
To sustain momentum, structure targets in two tiers:
- Good: Match industry averages as a minimum baseline
- Great: Hit top-quartile benchmarks as the ongoing goal
That gap between "good" and "great" gives every shift something to chase and turns individual accountability into a team habit.
Common Mistakes When Tracking Laundry KPIs
Even well-intentioned KPI programs break down in predictable ways. Watch for these three pitfalls:
Tracking Too Many Metrics at Once
Starting with 15+ KPIs creates analysis paralysis and dilutes focus. Begin with 5–7 core metrics, then expand as your tracking discipline matures. When every number demands attention, none of them get it.
Ignoring Root Causes
If PPOH drops, noting the number is only half the job. Investigate whether the dip stems from equipment downtime, staffing shortages, or workflow bottlenecks. Without that diagnosis, you're just collecting data — not improving operations.
Setting Targets Teams Can't Reach
If your current PPOH is 80, a 6-month target of 150 will backfire — it signals to your team that the baseline is broken, not improvable. Aim for 10–15% improvement per quarter and build momentum through achievable wins.
Frequently Asked Questions
What are KPIs for benchmarking in laundry operations?
KPIs are measurable metrics that track operational performance against goals. In laundry, the core ones are PPOH, rewash rate, labor cost per pound, utilities cost per pound, and on-time delivery rate — covering productivity, quality, cost, and customer satisfaction.
What are the 5 most important KPIs for laundry plants?
PPOH, rewash rate, labor cost per pound, utilities cost per pound, and on-time delivery rate. Each targets a different failure point — throughput, quality, labor waste, energy waste, and service reliability — so a gap in any one of them signals where to dig first.
What are the key maintenance KPIs for laundry equipment?
Track PM completion rate (target ≥95%), unplanned downtime rate (target <5%), and mean time between failures (MTBF). Proactive maintenance prevents costly breakdowns and preserves equipment efficiency, directly impacting PPOH and utilities cost.
What is the KPI of throughput in laundry operations?
Throughput measures total pounds processed per hour of plant operation. It differs from PPOH (which includes labor hours) and reveals capacity utilization. High throughput with low PPOH suggests labor inefficiency; low throughput with high PPOH suggests equipment bottlenecks.
How often should laundry KPIs be reviewed?
Operational KPIs like PPOH and rewash rate warrant daily or weekly review so you can course-correct fast. Financial and strategic KPIs — cost per pound, customer retention, turnover — are better reviewed monthly or quarterly, where trends become visible.
What is a good PPOH benchmark for commercial laundries?
PPOH benchmarks vary significantly by automation level: manual operations (30-40), moderate automation (70-90), and highly automated plants (150+). Focus on improving YOUR baseline by 10-15% per quarter through targeted interventions rather than comparing yourself to operations with different equipment and product mix.