Introduction
Picture this: It's 2 PM on a Tuesday at a high-volume healthcare laundry facility. Without warning, the primary washer-extractor seizes mid-cycle. The maintenance team scrambles to diagnose the problem while 500 pounds of wet linen sit locked inside. Meanwhile, three other washers sit idle, waiting for the rail system to clear.
This scenario plays out daily across industrial laundries nationwide. Unplanned downtime remains the #1 operational challenge for the industry, reducing productive capacity by 5-20% annually.
For facilities operating on tight margins and strict service-level agreements, that capacity loss translates directly to missed revenue, contract penalties, and emergency repair costs that run 3-5 times higher than scheduled maintenance.
Predictive maintenance offers a proven alternative to the firefighting approach. By monitoring equipment data continuously, facilities can spot problems weeks before failure occurs — and act on a schedule they control. This guide covers how predictive maintenance works in industrial laundry environments, which systems to monitor first, and what it takes to implement a program that actually sticks.
Key Takeaways
- AI-powered predictive systems detect equipment failures with 89–94% accuracy — bearing issues flagged 4–8 weeks before they cause downtime
- Reactive maintenance cuts equipment lifespan by roughly 40% and costs 3–5x more per repair than scheduled service
- Sensor installation runs $400–$1,500 per machine; cloud analytics add $75–$250/month — costs most facilities recover within months
- Facilities achieve ROI within 3–6 months through prevented downtime and optimized maintenance scheduling
- Predictive tools connect with platforms like Softrol's LOIS to give operations teams real-time plant performance data in one place
Common Causes of Unplanned Downtime in Industrial Laundries
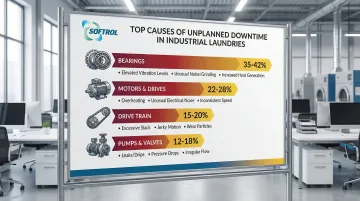
Understanding what fails—and why—is the foundation of any predictive maintenance program. Industrial laundry equipment develops predictable failure patterns that proper monitoring can catch weeks before a breakdown occurs. Four component categories drive the vast majority of unplanned stops: bearings, motors, drive trains, and pumps and valves.
Bearing Degradation and Wear
Bearing failures dominate industrial laundry breakdowns, accounting for 35-42% of all equipment failures. These critical components degrade gradually through contamination from water and chemicals, improper lubrication, shaft misalignment, or normal wear from constant high-speed rotation under heavy loads.
The progression is measurable. Bearings don't fail instantly—they deteriorate over weeks, exhibiting detectable warning signs:
- Subtle vibration increases at specific bearing frequencies
- Temperature rise of 5-10°C above baseline
- Changes in acoustic patterns (high-frequency squealing or grinding)
- Increased friction detectable through motor current analysis
Motor and Drive System Failures
Motor issues represent 22-28% of equipment failures in industrial laundries. These failures stem from electrical problems, thermal overload, winding insulation breakdown, and variable frequency drive (VFD) malfunctions caused by voltage spikes or harmonic distortion.
Predictive monitoring detects motor problems through:
- Current draw anomalies indicating winding resistance changes
- Power factor degradation signaling insulation breakdown
- Startup current irregularities revealing rotor bar issues
- Thermal patterns showing localized overheating in windings
Belt, Chain, and Drive Train Issues
Drive train components account for 15-20% of mechanical failures. Belts stretch and crack from heat exposure and chemical vapors. Chains wear from inadequate lubrication. Misalignment causes accelerated wear and energy waste.
Key warning signs include:
- Belt slip patterns detectable through speed differential monitoring
- Tension loss measured via deflection or frequency analysis
- Alignment drift visible through vibration signature changes
- Wear debris in lubrication systems
Pump and Valve Failures
Pumps and valves represent 12-18% of critical failures, affecting water supply, chemical injection, and drainage systems. Left unmonitored, cavitation destroys impellers, chemical exposure degrades seals, and mineral buildup seizes valves — often with little visible warning until flow stops entirely.
Detection methods include:
- Pressure monitoring showing flow restriction or cavitation
- Flow rate analysis identifying pump efficiency degradation
- Current signature analysis revealing mechanical binding
- Temperature monitoring detecting seal friction
What Happens When You Ignore Equipment Maintenance
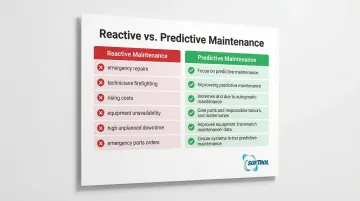
The reactive maintenance approach—fixing equipment only after it breaks—creates a cascade of financial and operational consequences that far exceed the cost of proactive care.
Financial and Operational Impacts
The direct costs are substantial. Emergency repairs carry a 3-5x cost multiplier compared to scheduled maintenance. Rush parts shipping adds 50-200% premiums. Overtime labor rates increase repair costs by 50-100%. For comparable industrial operations, unplanned downtime costs approximately $36,000 per hour.
Indirect costs compound the damage:
- Lost production revenue from idle equipment and missed delivery windows
- Customer service failures leading to contract penalties and lost accounts
- Secondary equipment damage when one failure cascades to connected systems
- Expedited outsourcing costs to meet commitments during downtime
Equipment Lifespan and Reliability Degradation
Small problems become catastrophic failures under reactive maintenance. A $200 bearing replacement becomes a $15,000 motor replacement when the bearing seizes — the shaft is damaged, windings burn out from electrical arcing, and friction heat warps the housing.
Reactive maintenance reduces equipment service life by approximately 40%. A tunnel washer designed for 20 years of service fails after 12 years when maintained reactively. Predictive maintenance, by contrast, can extend that lifespan by 20-35% — deferring millions in capital expenditure.
Warning Signs You're Operating Reactively
Your facility operates in reactive mode if you experience:
- Frequent emergency repairs disrupting production schedules
- Maintenance technicians constantly firefighting with no time for planned work
- Rising maintenance costs despite no increase in equipment age or production volume
- Inability to schedule maintenance windows because equipment "can't be spared"
- High percentage of unplanned downtime versus scheduled maintenance stops
- Parts inventory dominated by emergency orders rather than planned stock
How to Implement Predictive Maintenance in Your Facility
Predictive maintenance doesn't happen overnight — but a phased rollout makes it manageable. These steps walk you through the process, from identifying your highest-risk equipment to measuring program ROI.
Assess Your Current State and Prioritize Equipment
Conduct a criticality analysis identifying which equipment failures cause the most downtime and revenue loss. A tunnel washer failure, for instance, can halt your entire wash aisle for hours — while a single pocket dryer going down affects only a fraction of throughput.
Document current performance:
- Failure frequency for each major equipment type over the past 12 months
- Repair costs including parts, labor, and lost production
- Downtime hours per failure incident
- Secondary impacts (bottlenecks, quality issues, customer complaints)
Start with your 3-5 most critical machines rather than attempting facility-wide implementation. A focused rollout lets your team build real expertise, surface early wins, and limit exposure if something in the program needs adjustment.
Establish Equipment Baselines and Monitoring Protocols
Document normal operating parameters for each critical machine during known-good operation. These baselines become your comparison points when conditions start to shift.
Key baseline measurements:
- Vibration levels at bearing locations and motor mounts
- Operating temperatures for motors, bearings, and drive components
- Current draw patterns during startup, operation, and shutdown
- Cycle times and throughput rates
- Water and chemical consumption per load
Set monitoring frequency based on equipment criticality: daily checks for critical assets, weekly for important equipment, monthly for balance-of-plant machinery.
Select and Deploy Monitoring Technologies
Choose monitoring methods appropriate to your budget and technical capability. Options range from handheld tools requiring manual data collection to automated IoT sensors providing continuous monitoring.
Sensor placement strategies:
- Mount vibration sensors on bearing housings and motor casings
- Install temperature sensors at critical heat generation points
- Clamp current transducers around motor power leads
- Position flow meters on water and chemical supply lines
Typical costs range from $400–$1,500 per machine for sensor packages, with cloud analytics platforms running $75–$250 monthly (according to OXMaint's laundry maintenance cost data).
Train Your Team and Establish Response Protocols
Train maintenance technicians in data interpretation, trend analysis, and condition-based decision making. Technicians must understand what vibration signatures indicate, how temperature trends reveal developing problems, and when to escalate concerns.
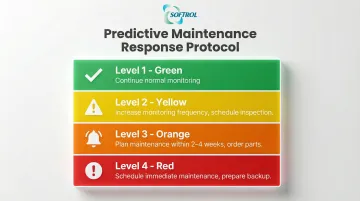
Create standardized response protocols:
- Green status: Continue normal monitoring
- Yellow alert: Increase monitoring frequency, schedule inspection
- Orange warning: Plan maintenance within 2–4 weeks, order parts
- Red alert: Schedule immediate maintenance, prepare backup equipment
Integrate predictive insights with your CMMS to ensure identified issues generate work orders automatically.
Measure Results and Refine Your Approach
Track key performance indicators:
- Unplanned downtime hours (target: 50% reduction in first year)
- Emergency repair frequency (target: 70% reduction)
- Maintenance cost per machine (target: 30–40% reduction)
- Mean time between failures (target: 40–60% increase)
Conduct quarterly reviews assessing prediction accuracy, false positive rates, and overall program ROI. Once you've proven ROI on the initial machines, expand monitoring to the next tier of critical equipment.
Technologies and Tools for Predictive Maintenance
Modern predictive maintenance leverages multiple technologies, from simple manual techniques to advanced AI-powered analytics platforms.
Vibration Analysis and Monitoring
Vibration analysis detects bearing wear, shaft imbalance, misalignment, and mechanical looseness weeks before failure. Detection windows typically provide 4-8 weeks advance warning for bearing issues.
Implementation options:
- Handheld vibration meters: Portable devices for periodic route-based checks ($2,000-$8,000)
- Permanently installed sensors: Continuous monitoring with automated alerting ($400-$1,000 per measurement point)
Thermal Imaging and Temperature Monitoring
Infrared cameras and temperature sensors identify overheating motors, electrical connections, bearings, and drive components before failure occurs. Temperature rise patterns—typically gradual increases of 5-10°C above baseline—indicate developing friction, electrical resistance, or lubrication problems.
Thermal imaging proves particularly effective for:
- Electrical panel connections showing high resistance
- Motor windings exhibiting insulation breakdown
- Bearing lubrication deficiencies causing friction heat
- Belt drive misalignment creating localized heating
Motor Current and Power Analysis
Current signature analysis reveals motor winding problems, rotor bar issues, and load anomalies invisible to other monitoring methods. Power monitoring detects efficiency degradation and electrical system problems 3-6 weeks before failure.
These systems integrate directly with existing electrical panels and VFD systems, requiring only current transducers and monitoring software rather than extensive hardware installation.
IoT Sensors and Connected Equipment
IoT platforms enable continuous automated monitoring of multiple parameters across entire equipment fleets. Components include:
- Wireless sensors: Battery-powered or energy-harvesting devices measuring vibration, temperature, pressure, and current
- Gateway devices: Data collectors transmitting via WiFi, cellular, or LoRaWAN networks
- Cloud analytics platforms: Analysis engines that identify patterns and flag developing failures
- Mobile alert systems: Real-time notifications delivered to maintenance teams
Modern industrial laundry equipment increasingly includes built-in connectivity, simplifying integration and reducing installation costs.
AI and Machine Learning Analytics
That connected data feeds directly into AI analytics — the layer that turns raw sensor readings into actionable predictions. AI platforms analyze patterns across thousands of machines to predict failures with 89-94% accuracy, and machine learning sharpens those predictions over time as it learns your specific equipment and operating patterns.
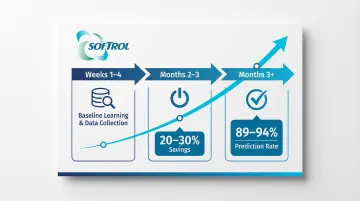
Most implementations follow a predictable ramp:
- Weeks 1-4: Baseline learning period collecting normal operation data
- Months 2-3: Early detection capabilities activate with 20-30% savings realization
- Months 3+: Full accuracy achieved, sustaining 89-94% prediction rates
Softrol LOIS Integration for Predictive Maintenance
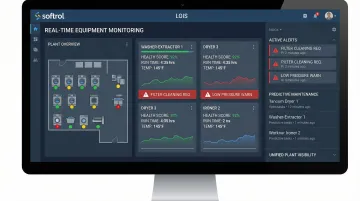
Softrol's LOIS (Laundry Operation Information System) provides the real-time data foundation essential for predictive maintenance programs. The system captures operational data across wash aisles, material handling, and finishing equipment, enabling trend analysis and anomaly detection.
LOIS delivers predictive maintenance capabilities through:
- Real-time monitoring: Tracks equipment performance 24/7, sending immediate email alerts when parameters deviate from established baselines
- Remote access: Equipment health visibility from any device—smartphone, tablet, or PC—so maintenance teams respond faster to early warning indicators
- LOIS PM Tracker: Tracks parts costs, labor costs, and equipment downtime while predicting future maintenance requirements by equipment
- Pan-N-Zoom technology: Provides real-time visualization of rail systems, allowing operators to view item-specific data, I/O status, and system health metrics
- Automatic parts quotation: Identifies replacement parts needs and generates quotation requests when components show degradation
LOIS integrates with Softrol's MicroPulse controllers across OEM equipment, creating facility-wide data flow. Machine-to-machine communication and automated processing interfaces give operations teams a single, unified view of plant health.
Building a Predictive Maintenance Culture
Technology alone doesn't create successful predictive maintenance programs. Cultural adoption and organizational commitment prove equally essential.
Leadership Commitment and Resource Allocation
Successful programs require management support for upfront investment, training time, and transition from reactive habits. Establish predictive maintenance as a strategic priority with dedicated budget and personnel.
At TMC Laundry, leadership commitment translated directly into results: the facility prevented 28 hours of downtime within the first 90 days, achieving a 471% annualized ROI. That outcome required executive backing for sensor deployment, team training, and process changes — none of which happen without a clear mandate from the top.
Technician Training and Skill Development
With leadership aligned, the next lever is your workforce. Invest in ongoing training covering data interpretation, condition monitoring, and predictive technologies. Build internal expertise through manufacturer programs, industry certifications, and hands-on mentorship.
Technicians who make this shift report higher job satisfaction — and less burnout. Moving from constant firefighting to planned, proactive maintenance reduces stress and opens the door to real professional development.
Continuous Improvement and Documentation
That development compounds over time when it's captured. Maintain detailed records of predictions, actions taken, and outcomes. This documentation sharpens prediction accuracy and preserves institutional knowledge even through staff turnover.
Conduct regular team reviews of:
- Prediction accuracy rates and factors affecting precision
- Missed failures requiring root cause analysis
- False positives and threshold adjustments
- Overall program ROI and cost-benefit trends
Over time, this review cycle turns your maintenance history into a competitive asset — one that makes every future failure easier to predict and prevent.
Conclusion
Unplanned downtime is preventable. The shift from reactive firefighting to predictive maintenance transforms industrial laundry operations, preventing failures before they occur and cutting the capacity losses that cost facilities 5-20% of annual production.
Implementation doesn't require massive upfront investment. Start with your most critical equipment:
- The tunnel washer handling 60% of your volume
- The rail system that creates bottlenecks when it fails
- The dryers that force production delays downstream
Deploy proven manual techniques like vibration analysis and thermal imaging first, then build toward automated monitoring as your data matures.
Take action this week: Assess your current maintenance approach, identify your three most critical assets, and begin establishing monitoring baselines. The data you collect today becomes the foundation for preventing tomorrow's breakdowns — and the basis for smarter automation decisions down the road. Softrol's control systems and LOIS plant management platform are designed to support exactly that progression, from baseline monitoring to full predictive visibility across your operation.
Frequently Asked Questions
What does PM program mean?
PM (Preventive Maintenance) programs schedule maintenance by time intervals or usage metrics, such as oil changes every 500 hours or bearing inspections each quarter. Predictive maintenance improves on this by triggering work only when equipment condition data signals a developing problem, not a calendar date.
What are the 4 types of maintenance management?
The four approaches are: reactive (fix when broken), preventive (scheduled time-based maintenance), predictive (condition-based maintenance using real-time data), and proactive (root cause elimination to prevent failures).
What are the 5 types of preventive maintenance?
The five types are: time-based (calendar schedules), usage-based (runtime hours or cycle counts), condition-based (sensor-driven), reliability-centered (criticality-prioritized), and prescriptive (AI-optimized scheduling). Industrial laundries typically get the best results by combining condition-based and time-based methods.
What is the most common fault on a washing machine?
Bearing failures are the most common issue in industrial washers, accounting for 35-42% of failures, followed by motor problems at 22-28%. Predictive maintenance detects bearing degradation through vibration analysis and temperature monitoring 4-8 weeks before failure, allowing scheduled replacement during planned downtime.
How long do industrial laundry machines last?
Typical service life ranges include 15-20 years for washer-extractors, 15-25 years for tunnel washers, and 12-18 years for dryers. However, predictive maintenance can extend these lifespans by 20-30% through early problem detection and optimal maintenance timing, while reactive maintenance reduces expected life by 40%.
What maintenance should be done on a washing machine?
Core predictive maintenance tasks for industrial washers:
- Monthly vibration checks on bearings and motors
- Quarterly thermal scans of electrical systems and drive components
- Continuous monitoring of cycle times and water consumption
- Bearing lubrication triggered by condition data, not calendar intervals
- Belt tension verified by measurement, not visual inspection